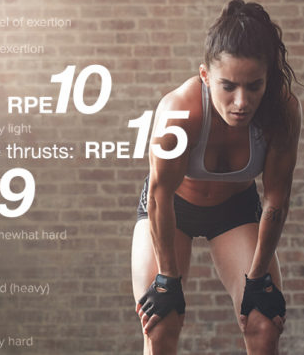
RPE Scale
The standard RPE chart looks like this.
| RPE Rating | Level of exertion |
| 6 | No exertion |
| 7 | |
| 8 | |
| 9 | Very light |
| 10 | |
| 11 | Light |
| 12 | |
| 13 | Somewhat hard |
| 14 | |
| 15 | Hard (heavy) |
| 16 | |
| 17 | Very hard |
| 18 | |
| 19 | Extremely hard |
| 20 | Maximal exertion |
Why 6-20?
“It’s designed to correspond roughly with heart rate divided by 10,” says Dr. Eric Helms, an exercise scientist at the Sports Performance Research Institute New Zealand. At rest, he explains, a fit person typically has a heart rate of about 60 — so their Borg RPE will be a six; during maximal exertion that same exerciser may hit 200 — so their RPE will be 20.